While there still can be snow in May, I think it’s time to wrap up the forecast for year. Let’s first recap the season, and then let me share my lessons learned from the forecast this season.
Recap
Setting aside the elephant in the room of COVID-19, it was an amazing season. October, March, and April all had big storms. But the true winner was February, where a powerful jet streak gave us a one-two punch of measuring snow in many feet as opposed to many inches. I think the below graph says it all, which shows the total SWE (snow water equivalent) at the Lake Eldora Snotel site. Not once in the entire year were we ever below average. That’s pretty great.
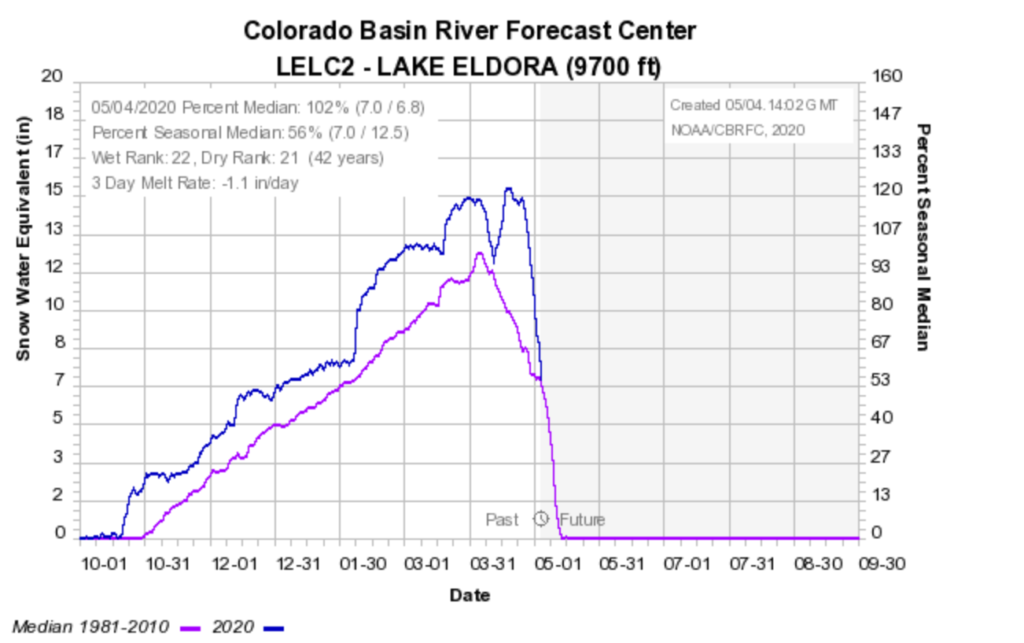
Blue is this year. Purple is median.
Lessons Learned
So, what did I learn from this year of forecasting? Here are my three big takeaways. First, it’s not to underestimate jet streaks as a snow producer. Second, if there’s a model that’s an outlier, I should put that into my forecast discussion – I’m still embarrassed only calling for 60+ mph winds in the storm that went well north of 100 mph. I should have noted that one model was showing winds off the chart, as at least everyone would have known of the possibility. Third, as some of you have heard at some of our patrol classes, I realized that a good forecast discussion is 75% reporting. Generally you don’t, and shouldn’t, care what I think. I’m just trying to report to you what the models are saying so you can reach your own conclusions. And, 25% of the forecast discussion should be an op-ed – where I share my opinions and thoughts of what might happen – though never losing sight of my primary role as a reporter.
How Did the Models Do
Now, what did I learn about the various numerical models’ forecasting ability for our patrol zone? It’s easy to say that the best model in the world is the European Model – but does its amazing hurricane prediction in the Gulf of Mexico really show that it’s better at forecasting snow in the Indian Peaks? Spoiler alert, the answer is no.
As I’m sure was obvious from reading the forecasts this winter, I wanted to get a sense of how each of the major numerical weather models performed throughout the season. As you’ll have noted in my recaps after each forecast, I’ve called out models for having performed particularly well or particularly poorly as to snowfall predictions. Below, I put pencil to paper in figuring out how the models performed, comparing total references to models with the number of compliments or insults I doled out in my retrospective discussions.
This analysis is, admittedly, rather subjective. It’s based upon my own take in calling models out in my retrospective discussions. Perhaps to put it more bluntly, this isn’t real science, rather its running numbers based upon somewhat subjective and varying comments on how well or poorly models did. Also, it’s worth noting that for the first month of forecasts I wasn’t doing as good of a job comparing how the models predicted snow versus what occurred. And, in mid-March I lost the ability to judge results on the Eldora Snowstake Webcam due to COVID-19 shutting down Eldora – so I had to compare the forecasts with the less reliable snotel data of what actually occurred. Nevertheless, I still think this analysis is quite interesting.
Let’s first dive into the numbers, and then let’s look at what conclusions, if any, we can draw. I’m only going to analyze the models I referred to by name in more than ten forecasts as there just isn’t sufficient data on the other models. I referenced the American and Canadian models 44 times, the European Model 31 times, the WRF model 30 times, and the NAM model 21 times. All other models (e.g., HRRR, RDPS) I referenced fewer than 10 times.
Good calls – First, let’s compare the total number of references in the forecasts, to the number of times I remarked in the recap discussion how accurate any particular model turned out to be in snowfall prediction. Here are the percentages of times I complimented a model for doing a nice job. NAM – 29%; WRF – 27%; Canadian – 23%; European – 23%; American – 18%. It’s not surprising that the regional shorter term models (i.e., the NAM and WRF) outperformed the global medium term models – as among other things I didn’t break out the numbers by how far away the forecasts were. The one surprise from all of this is how poorly the American model performed. But wait, things are about to get both more interesting and more confusing.
Bad calls overall – Second, I compared the number of times I criticized each of the models in a recap to the total references in forecasts. The numbers were interesting, and to some extent an unexpected flip of the good call numbers. I criticized the models the following percent of forecasts: NAM – 43%; Canadian – 36%; European – 35%; WRF – 33%; American – 27%. So, just looking at good calls overall and bad calls overall – its hard to reach meaningful conclusions except the WRF seems to be above average in good calls and below average in bad calls.
Too optimistic – Okay, let’s now look at how often the models overpredicted snowfall. Overall I called out the Canadian Model the most number of times for being too optimistic, but it was never ridiculously over optimistic. Only four times the whole season did I call out a model for being embarrassingly too optimistic, twice with the American and twice with the WRF. So, when the Canadian, European, or NAM models are predicted gigantic snowfalls, not once were there not at least significant snowfalls. Weighted numbers of how often a model was too optimistic is as follows (labeled as a percent, though not technically a percent): WRF – 23%; Canadian – 14%; American – 11%; European – 10%; NAM – 5%. In other words, the most likely to overpredict snow is the WRF, and least likely to overpredict snow is the NAM.
Too pessimistic – With the lone exception of the WRF Model, the models all tended to underpredict snow a lot more often than they overpredicted snow, which is a bit surprising. In fact, only the WRF had the same amount of overpredictions as underpredictions. I’ve often faulted the University of Utah’s downscaled ensemble for being too optimistic (University of Utah doesn’t have a downscaled ensemble for anywhere in our patrol region) – so it was interesting to see that all the models except for the WRF Model in our patrol zone were too pessimistic. Weighted numbers of how often a model was too pessimistic is as follows (labeled as a percent, though not technically a percent): NAM – 57%; European – 42%; American – 36%; Canadian – 31%; WRF – 23%.
So, what are the lessons learned as to each of the models?
If I had to pick the best model of the season, it was the WRF model. All the other models tended overall to underpredict snow, while the WRF seemed even in its over and underprediction. And, it was the only model to be above average in total good calls and below average on total bad calls.
Surprisingly, this analysis didn’t favor the regional models over the global models. While the WRF did the best, I would have thought that the NAM would have been the number one or two as it’s regional. However, the NAM had a rather poor showing. The NAM was the worst offender for underpredicting, but it also received the most compliments for good forecasting through the year.
Also interesting was that the conventional wisdom, backed up by multiple studies, on the most accurate models seemed to have no correlation to our little corner of the world. The European Model is generally considered to be the best global model in the world, with the American Model second, and the Canadian Model third. However, for our little patrol region neither the European nor American models did particularly well, and probably the Canadian model was just slightly more accurate overall.
Thanks everyone with your patience with these forecasts, and I welcome you suggestions for next years’ forecasts.
K.B.O.
-Jordan (Monday (5/4/20) Morning)
Note: Unless otherwise noted, all forecasts are for 10,000’ in exposed areas. References to American Model are the American (GFS) Model. References to the Canadian Model are the Canadian (GDPS) Model. References to the WRF Model are the CAIC WRF Hi-Res Model. References to the European Model are the European (ECMWF) Model.